It can be difficult to picture what an IR spectrum would look like just from the peak and intensity listing. If you want to make it look like an IR spectrum found by experiment, you may want to use a program to create a realistic looking spectrum with the peaks shown with some Gaussian line broadening.
There are a couple of programs that I know of now to do this. Two are to use on your Mac or PC. I haven't really checked those out but I will give a link to them here:
The program that seems to be the nicest and most portable one to use is for Linux/UNIX. It will strip the frequencies out of the Gaussian output file and create two files. One file ending in .ir has a listing of the peaks found by Gaussian with their intensities. Another file ending in .prn is a listing of coordinates to make a pretty spectrum. Peaks are represented as a Gaussian function. This file can be read into Excel to create a nice looking spectrum. The entries are space delimited. The program is called gautoir, a program by Stephan Matzinger, Inst. of physical Chemistry, Univ. Fribourg (CH), 1994. Please cite the program if you use it!
You can call on autoir by typing on sgi's or linux:
>autoir name of gaussian freq file, w/o .log extension
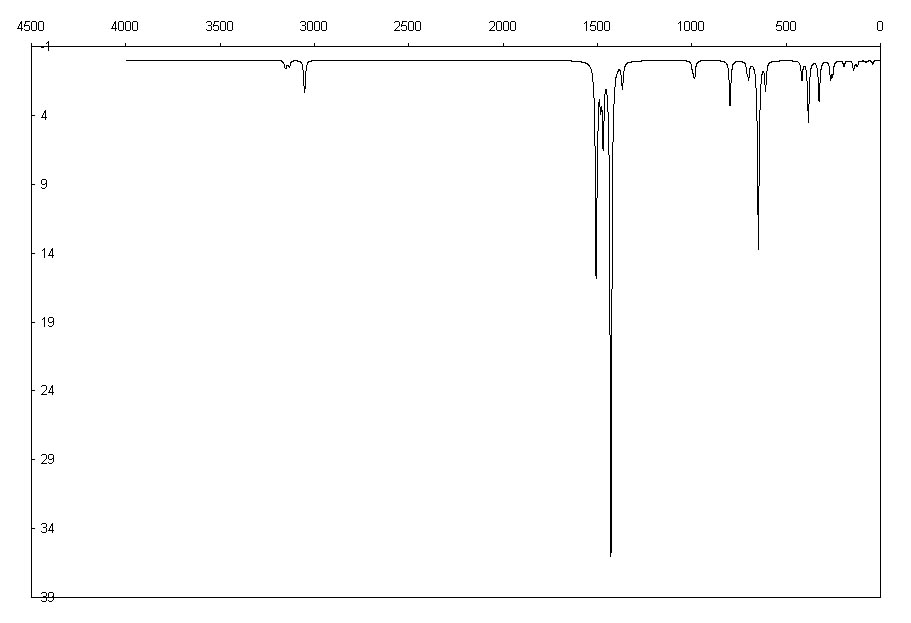
Here is a quick spectrum I made with gautoir drawn with Excel: