Spectrum: Usually
a plot of some property (such as energy or mass) on the x-axis versus quantity of
this property along the y-axis.
In simple terms, a spectrum is a plot of 'thing' versus 'how
much of that particular thing'.
 |
 |
 |
||
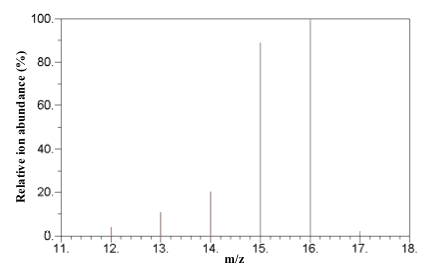
| A mass spectrum is a plot of m/z on the x-axis versus relative ion abundance on the y-axis. | |
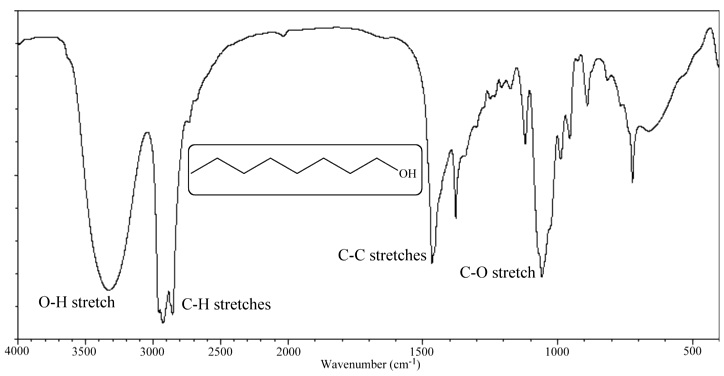
An infrared spectrum is a plot of stretching frequency (photon energy) on the x-axis versus transmittance or absorbance along the y-axis. | |
An NMR spectrum is a plot of chemical shift (normalized spin flip energy) on the x-axis versus intensity along the y-axis. Because it is the integrals (the areas under the NMR signal peaks), and not the height of the signals that are important, the y-axis of the NMR spectrum is generally ignored. |